Leveraging Instrumentation Metadata
(This is the third post related to this project, see first or second posts about this project for more context.)
It’s been really awesome working at Grafana and being able to focus full time on OpenTelemetry. I am making a lot more progress on my metadata project, and am now beginning to collaborate with others on identifying more places where this work might be useful outside just java.
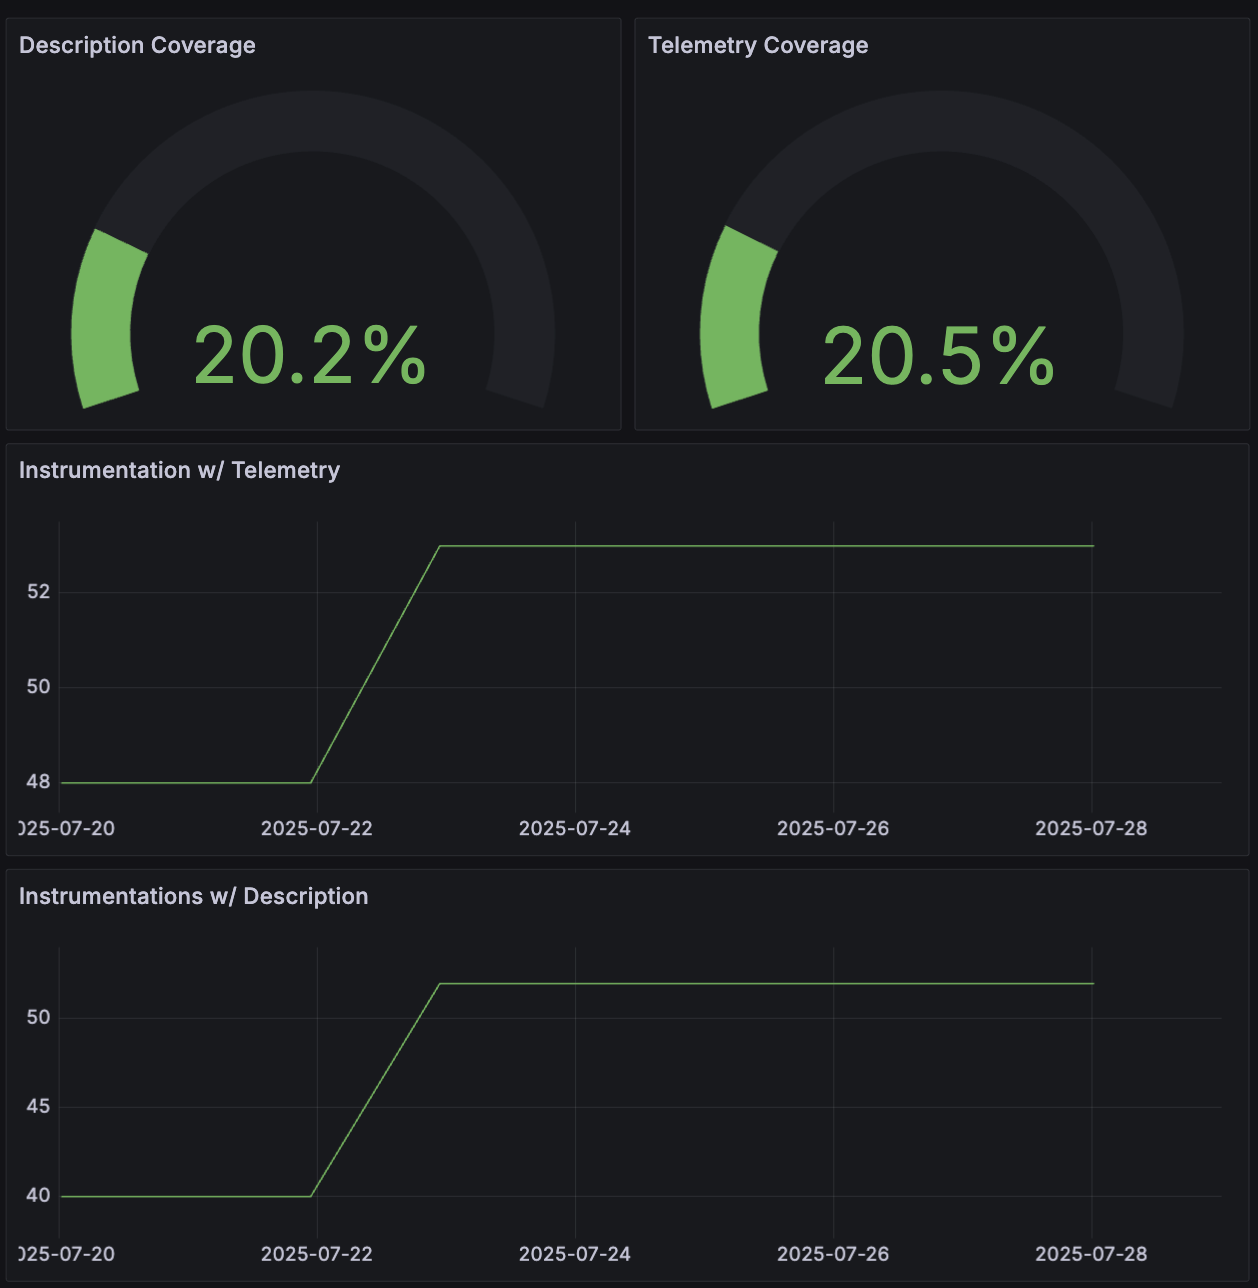
Now that we have made some good progress on populating the metadata for a number of instrumentations (~20%), I decided it was a good time to start experimenting with using it in various ways in order to demonstrate how we can leverage it. I began putting together a small UI to be able to experiment with different ways of visualizing and navigating the data for each module. I also started creating some additional automation with Github actions, and built a dashboard to track my progress of populating the metadata within the java repo.
Benefits
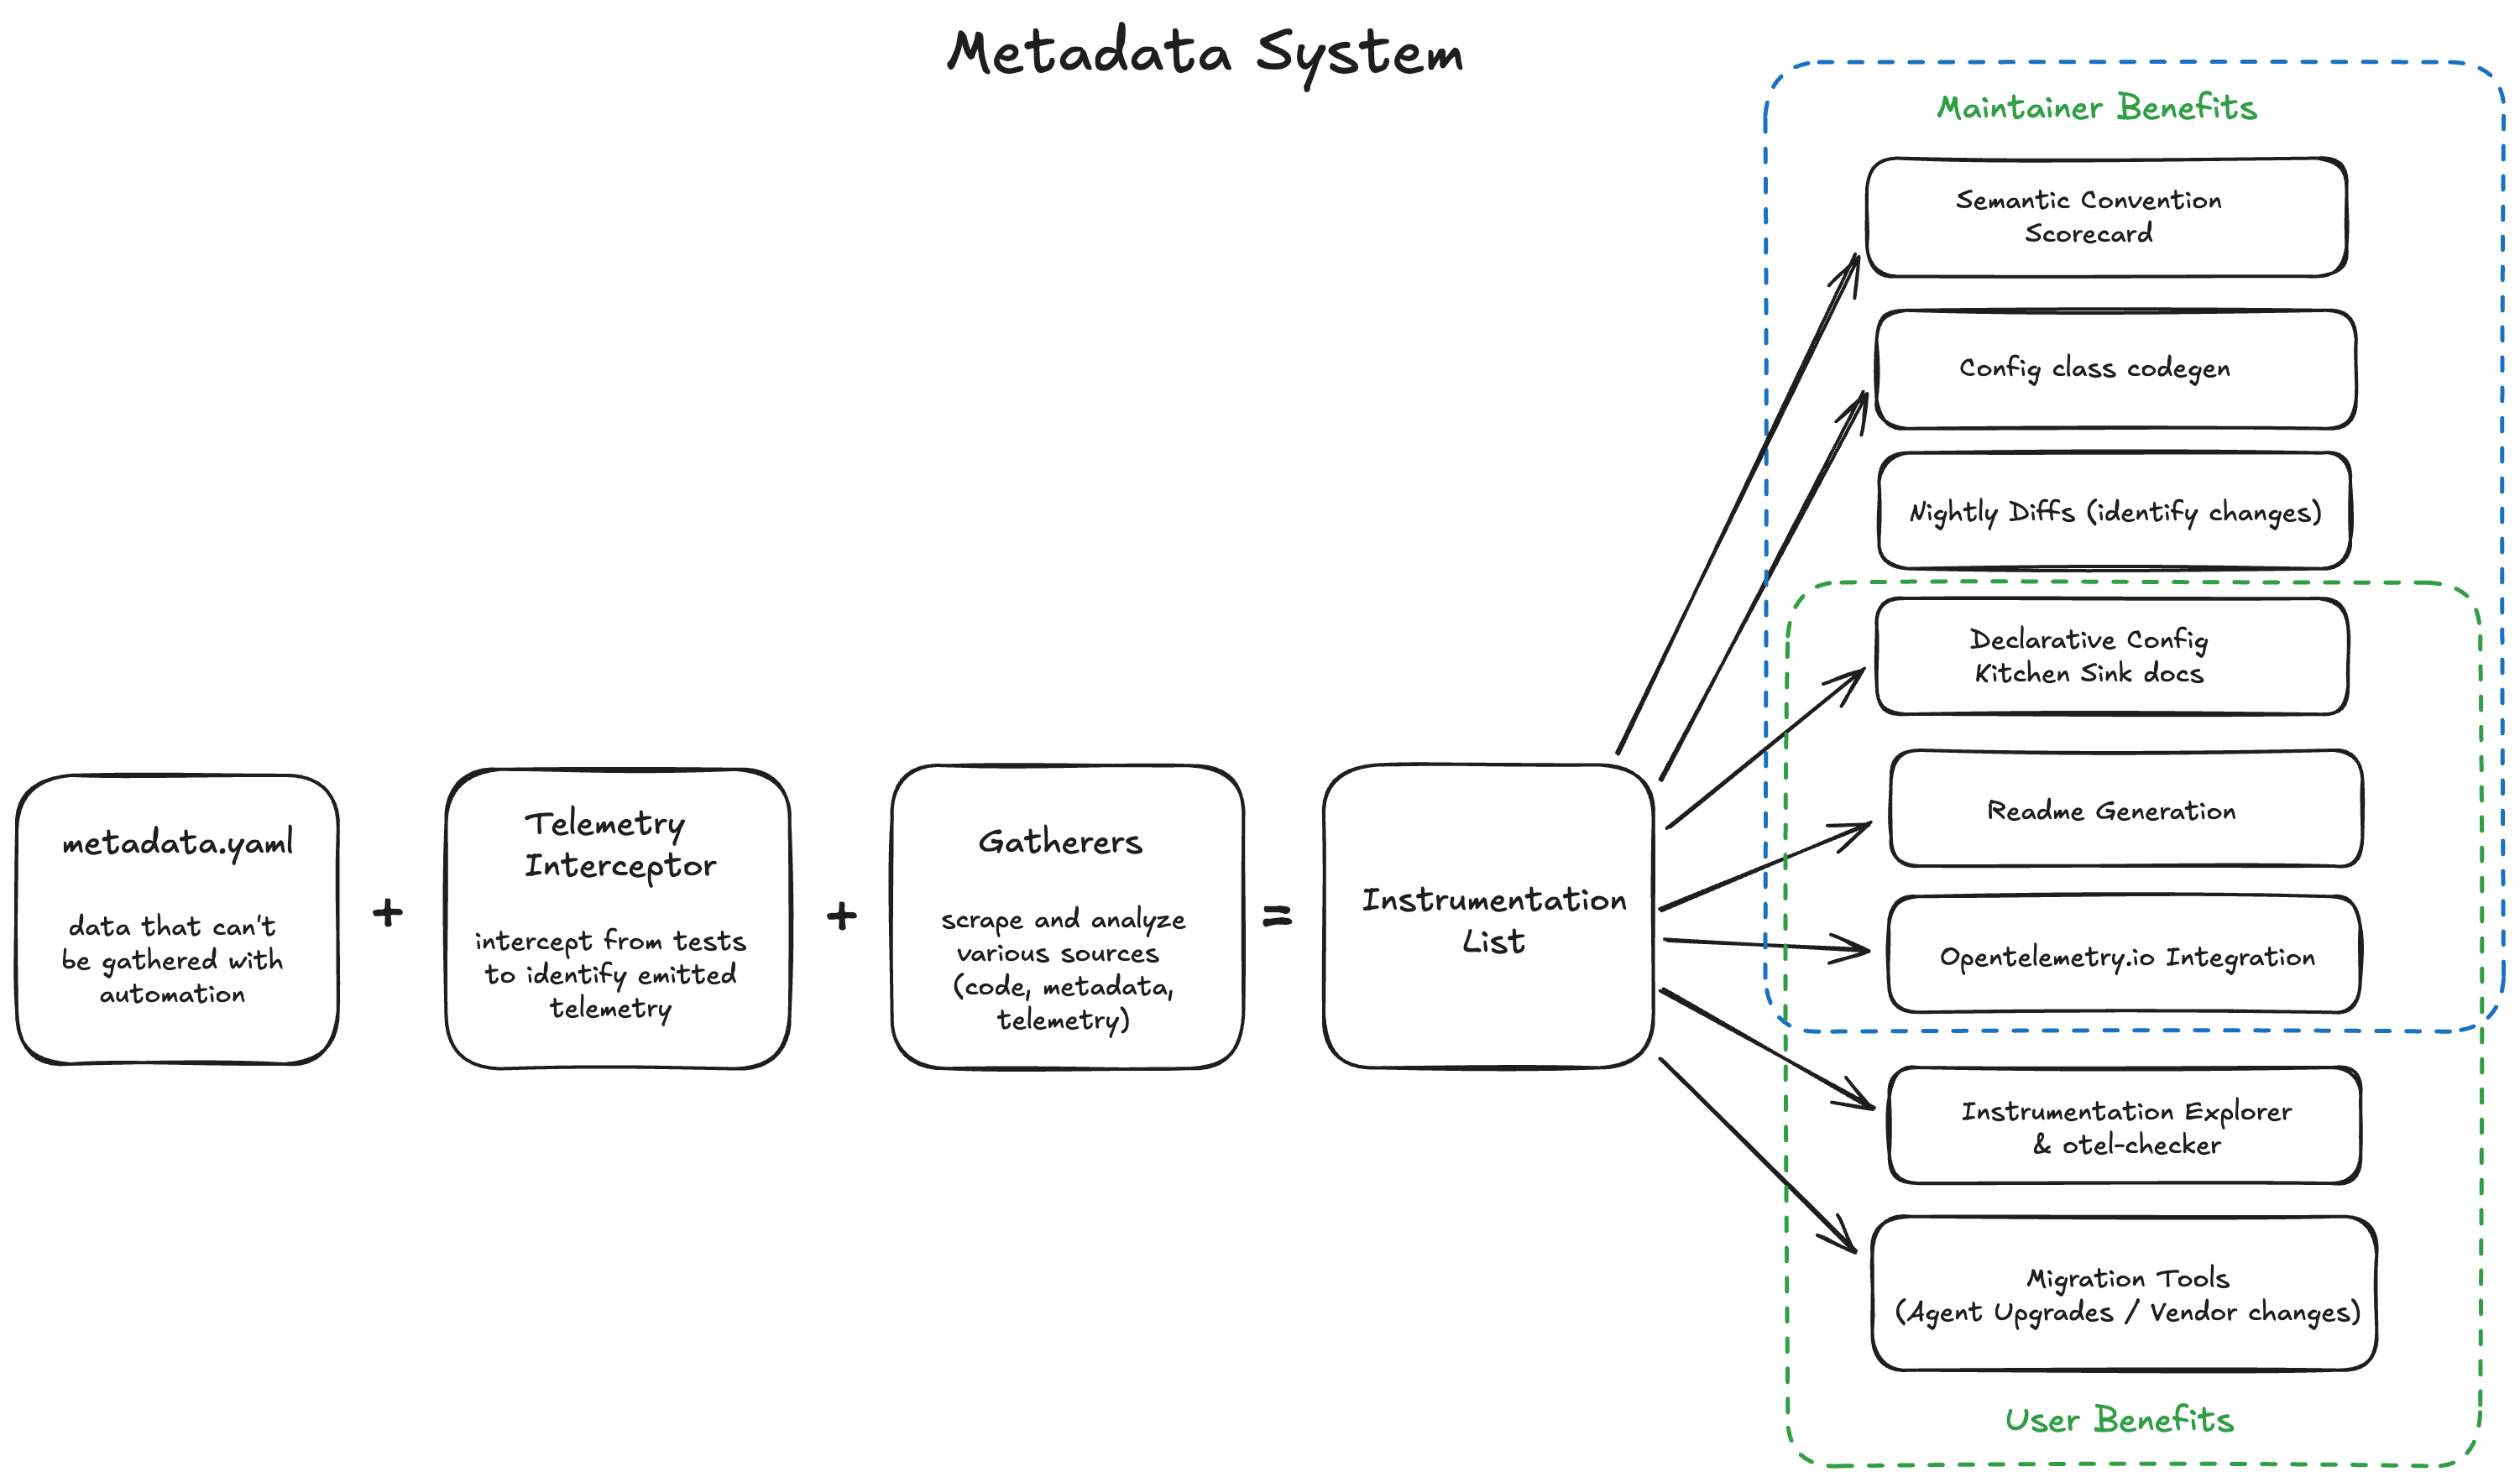
There is so much we can do with this data that can benefit both the maintainers of the agent and end users. I started trying to brainstorm some of the things I had in mind and am working towards. In my head, users and vendors will benefit from more granular documentation and the ability to perform automated migrations. Maintainers and contributors will benefit from de-mystifying the large number of modules within the agent, and being able to build tooling to help manage it all. A lot of the benefits also overlap all of the groups.
Instrumentation Explorer Experiment
For the past several months I’ve been rambling about yaml files and metadata at the Java SIG meetings, and I felt it was time to finally put a nice coat of paint on it all, so it could be a little more interesting and I could better articulate the “vision” of what we’re working towards.
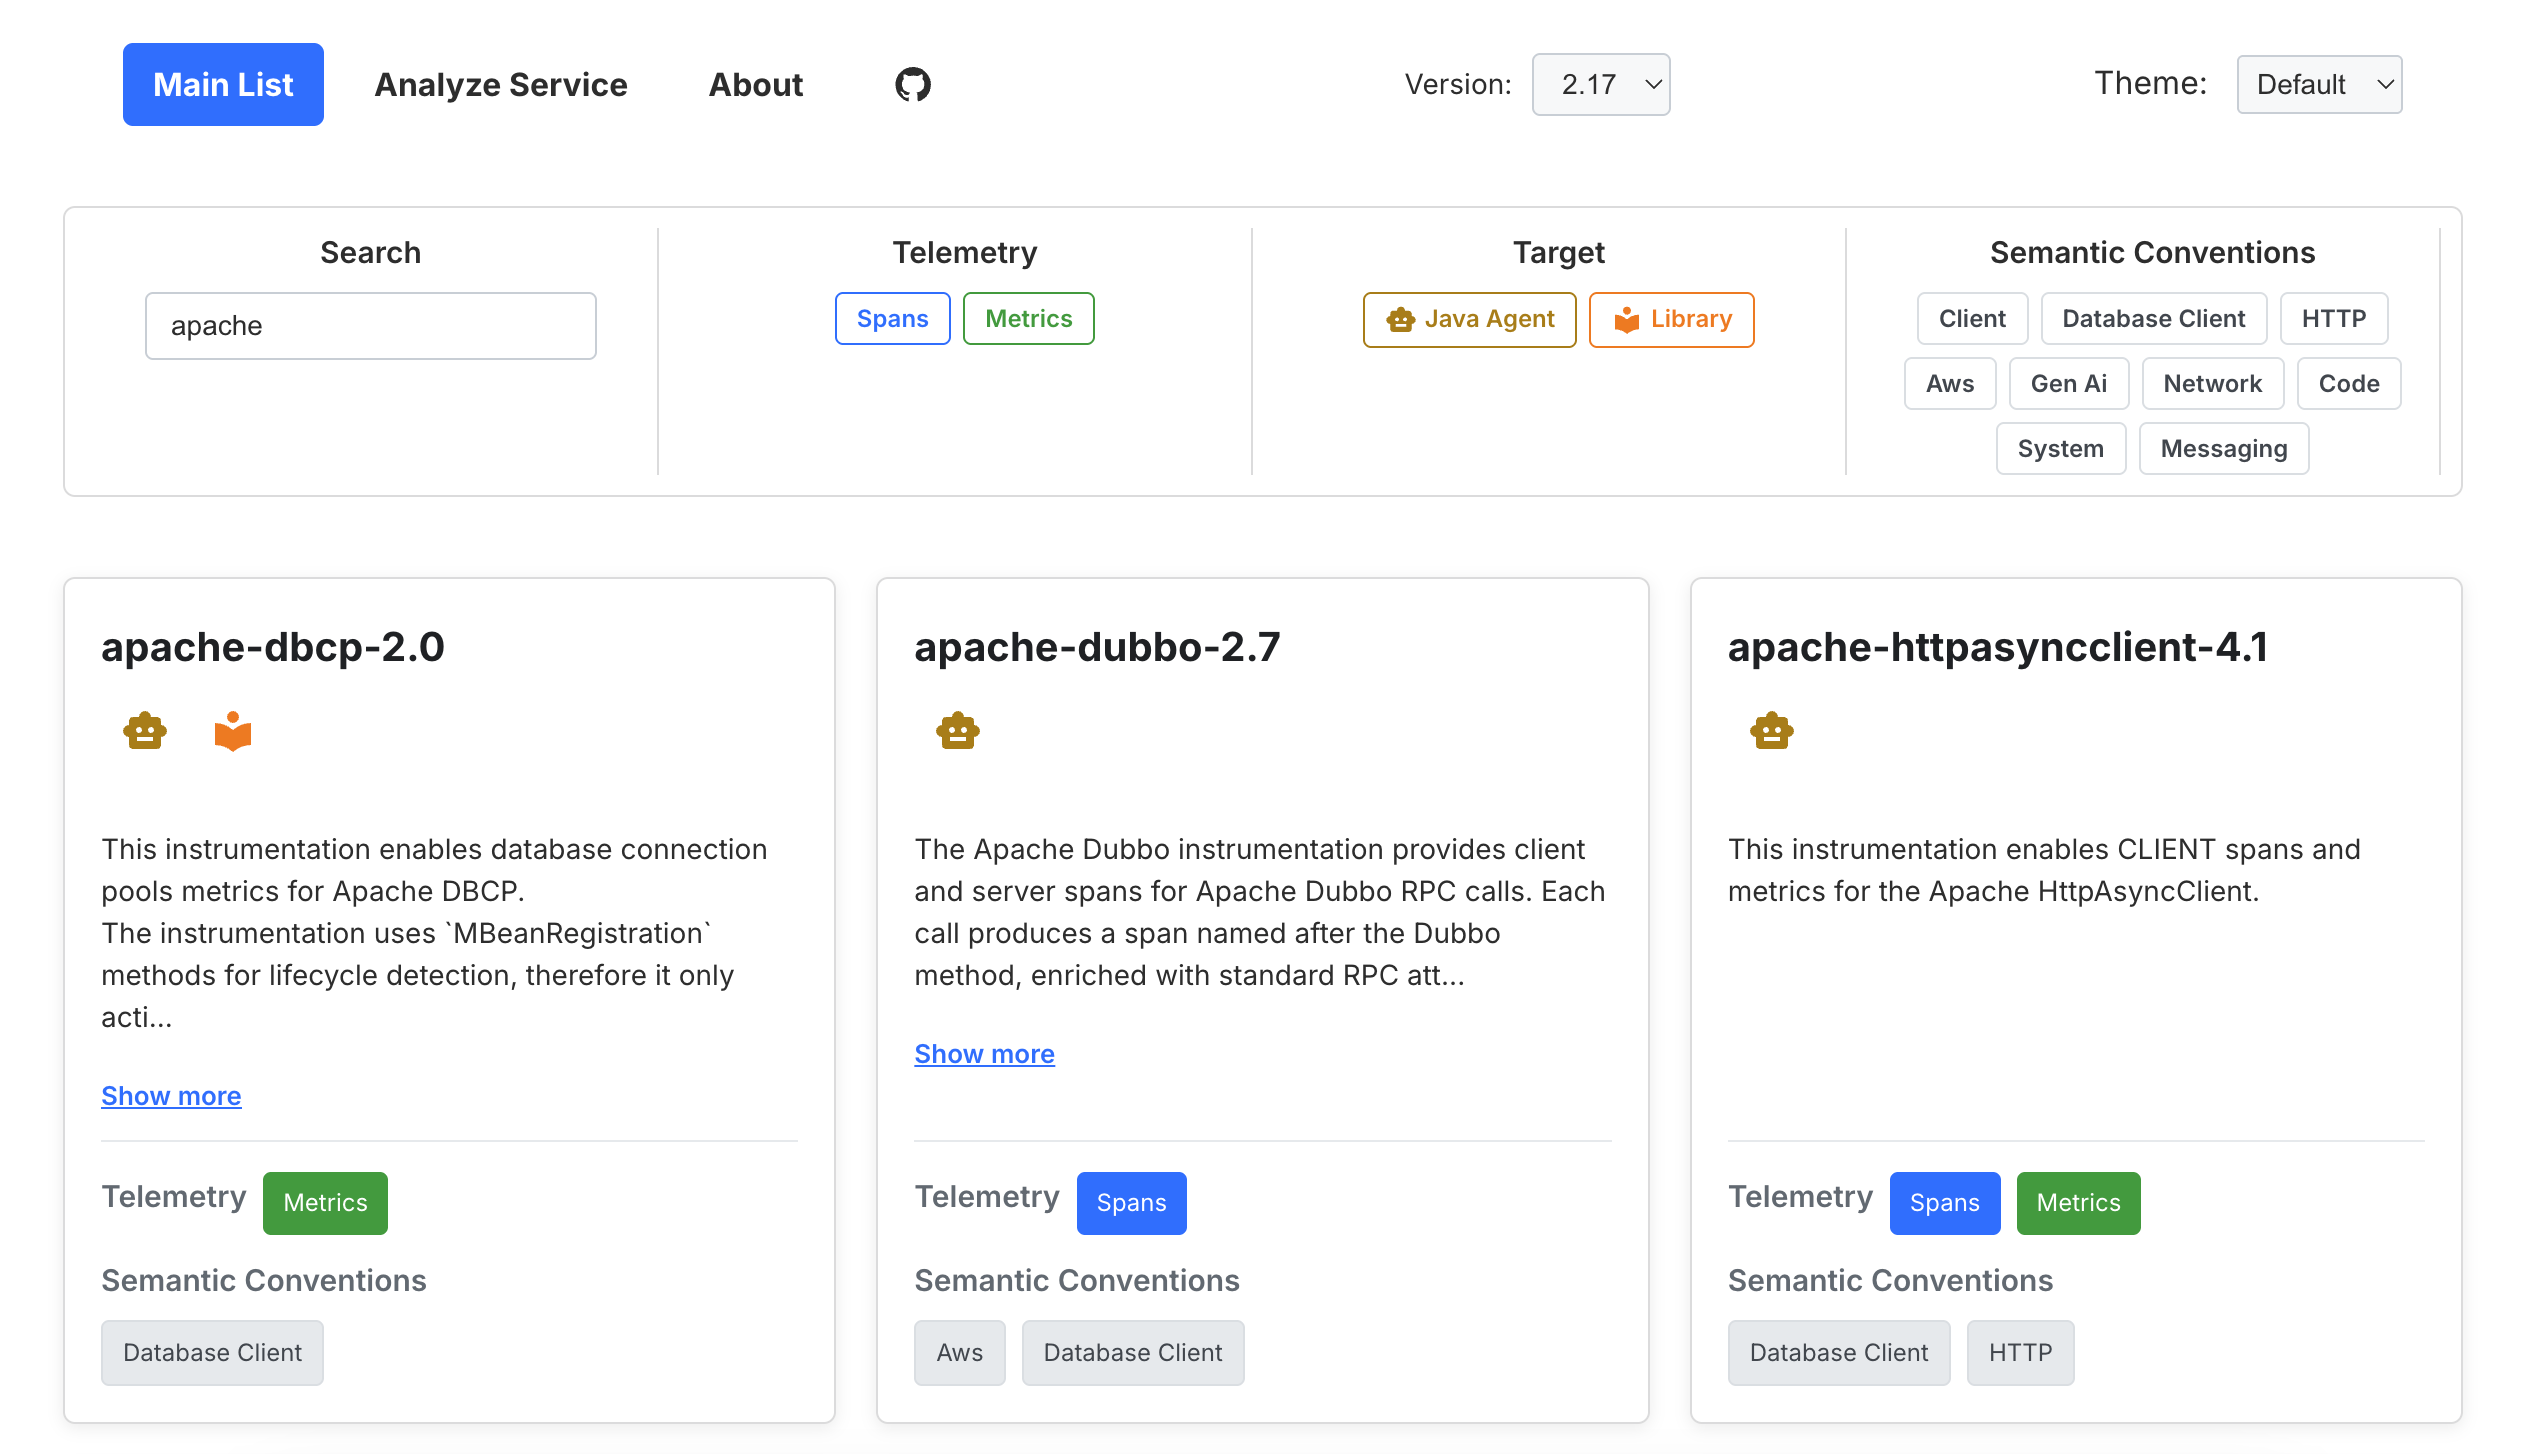
One of the ideas I had is a UI that provides an “instrumentation explorer”, which provides some nice visualizations for the metadata. I threw together a proof of concept UI with a handful of features to show off some capabilities
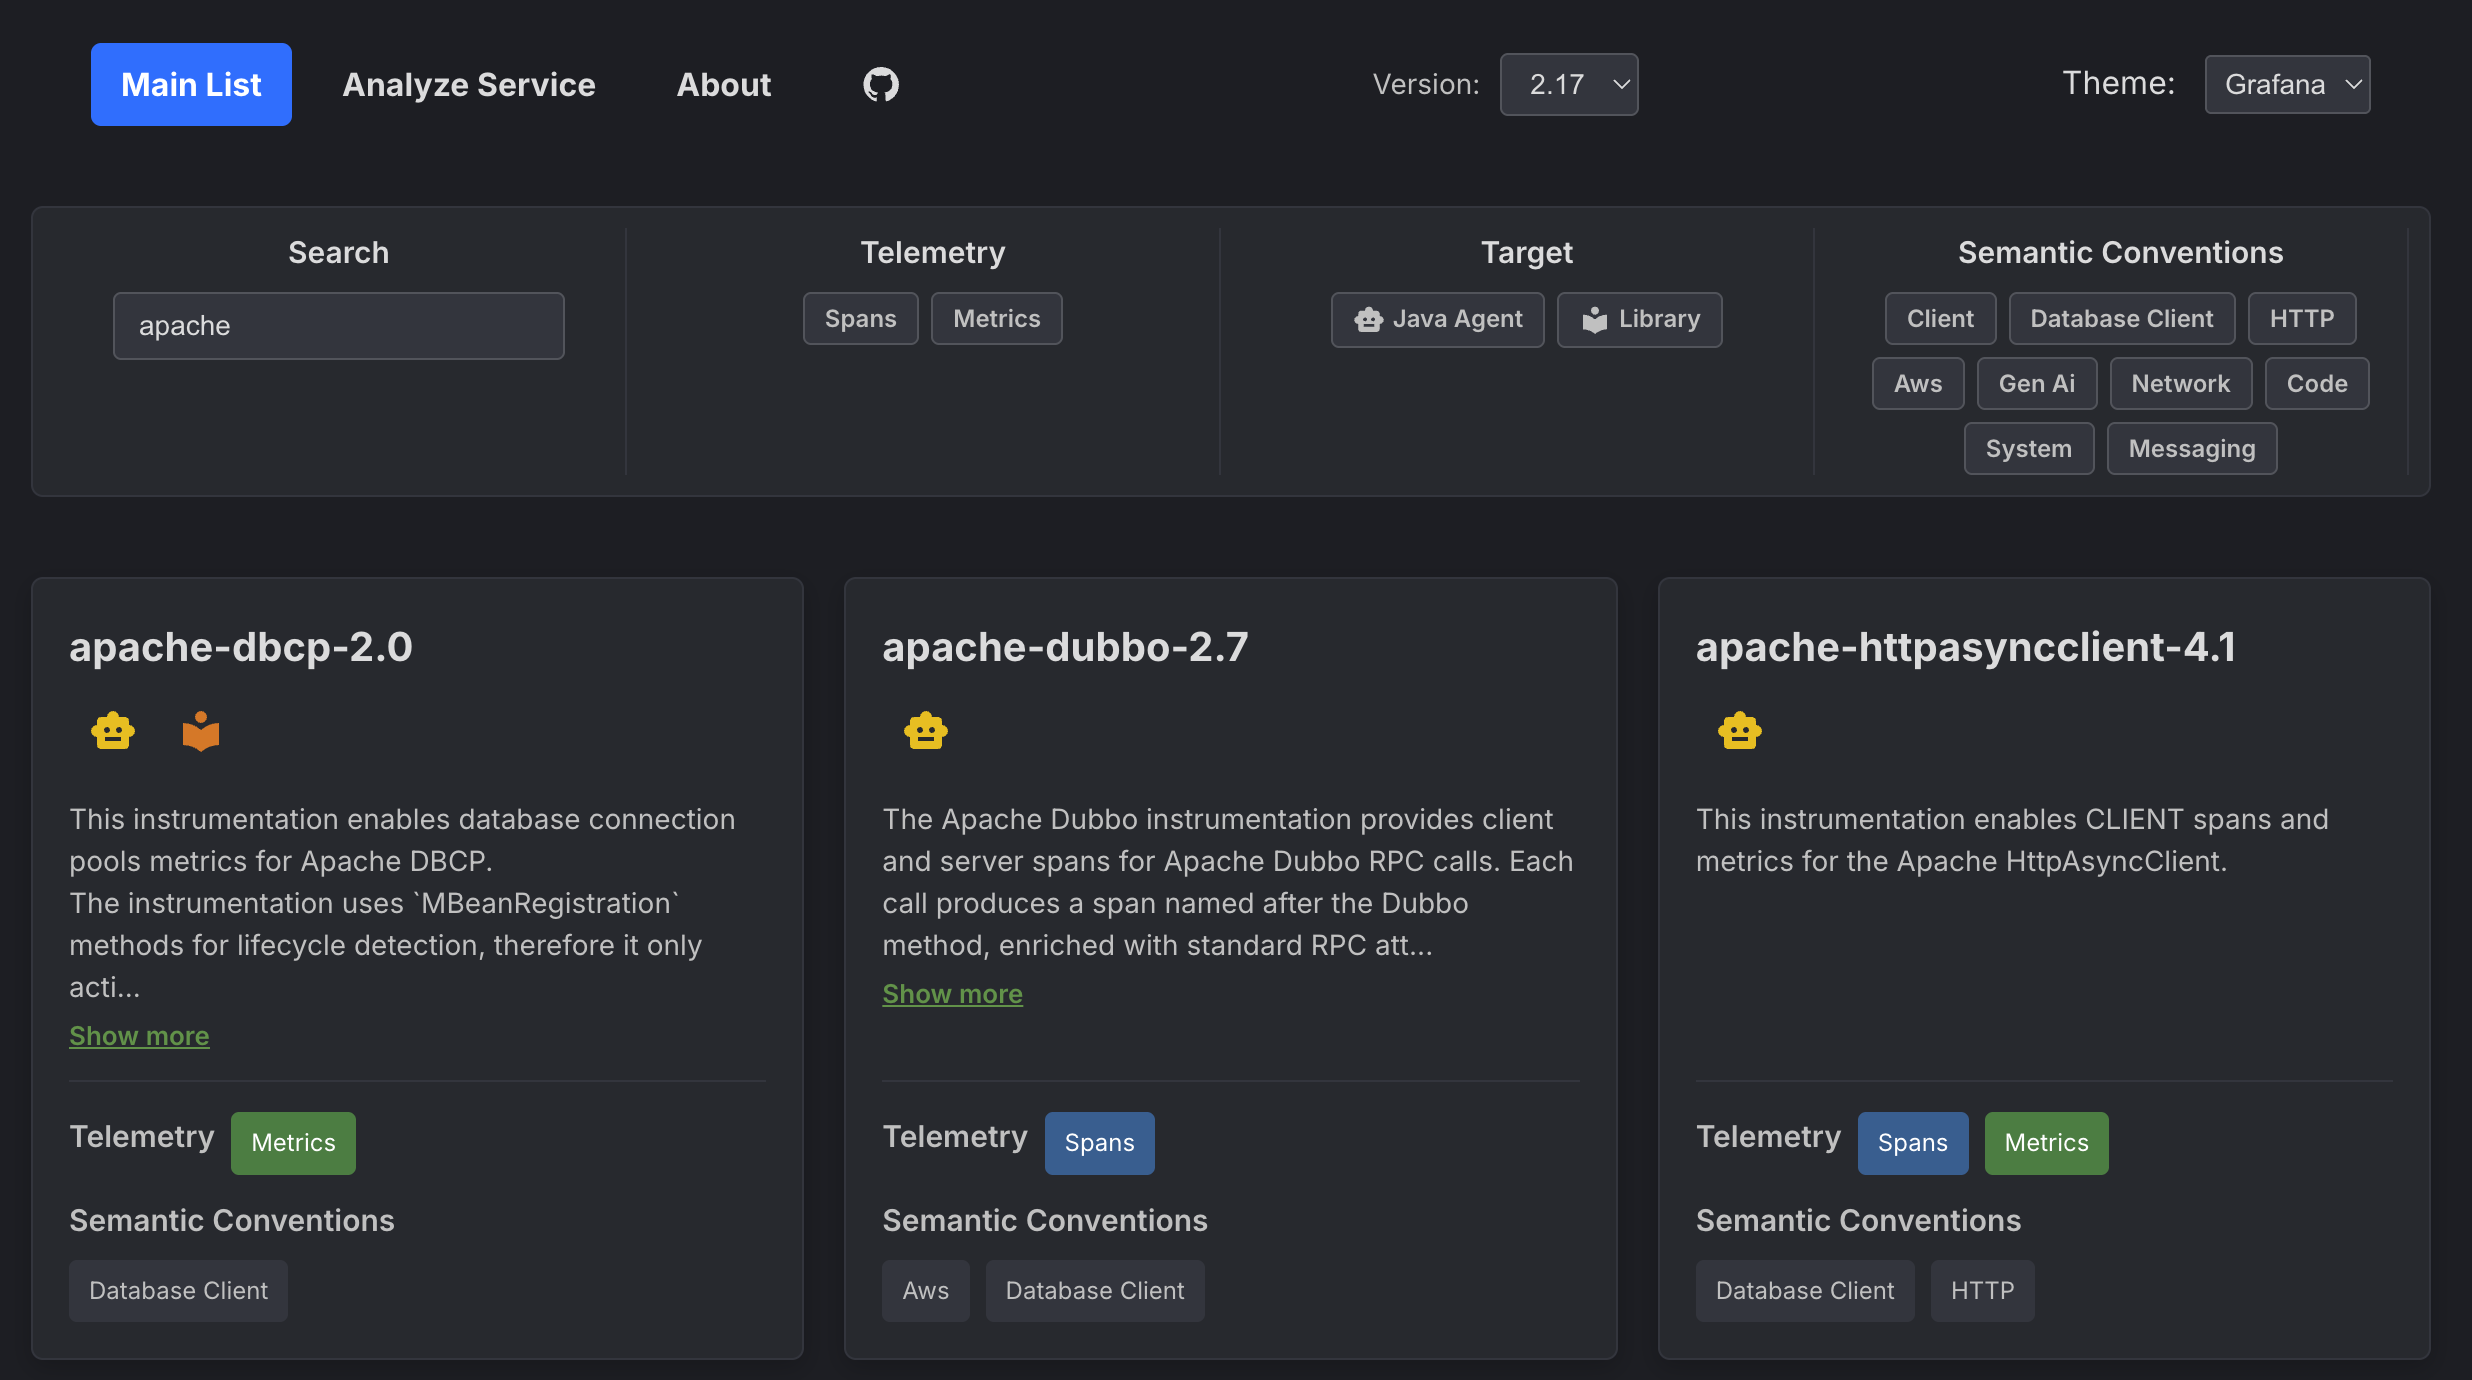
And because I’m now a Grafanista, I of course added a Grafana inspired theme:
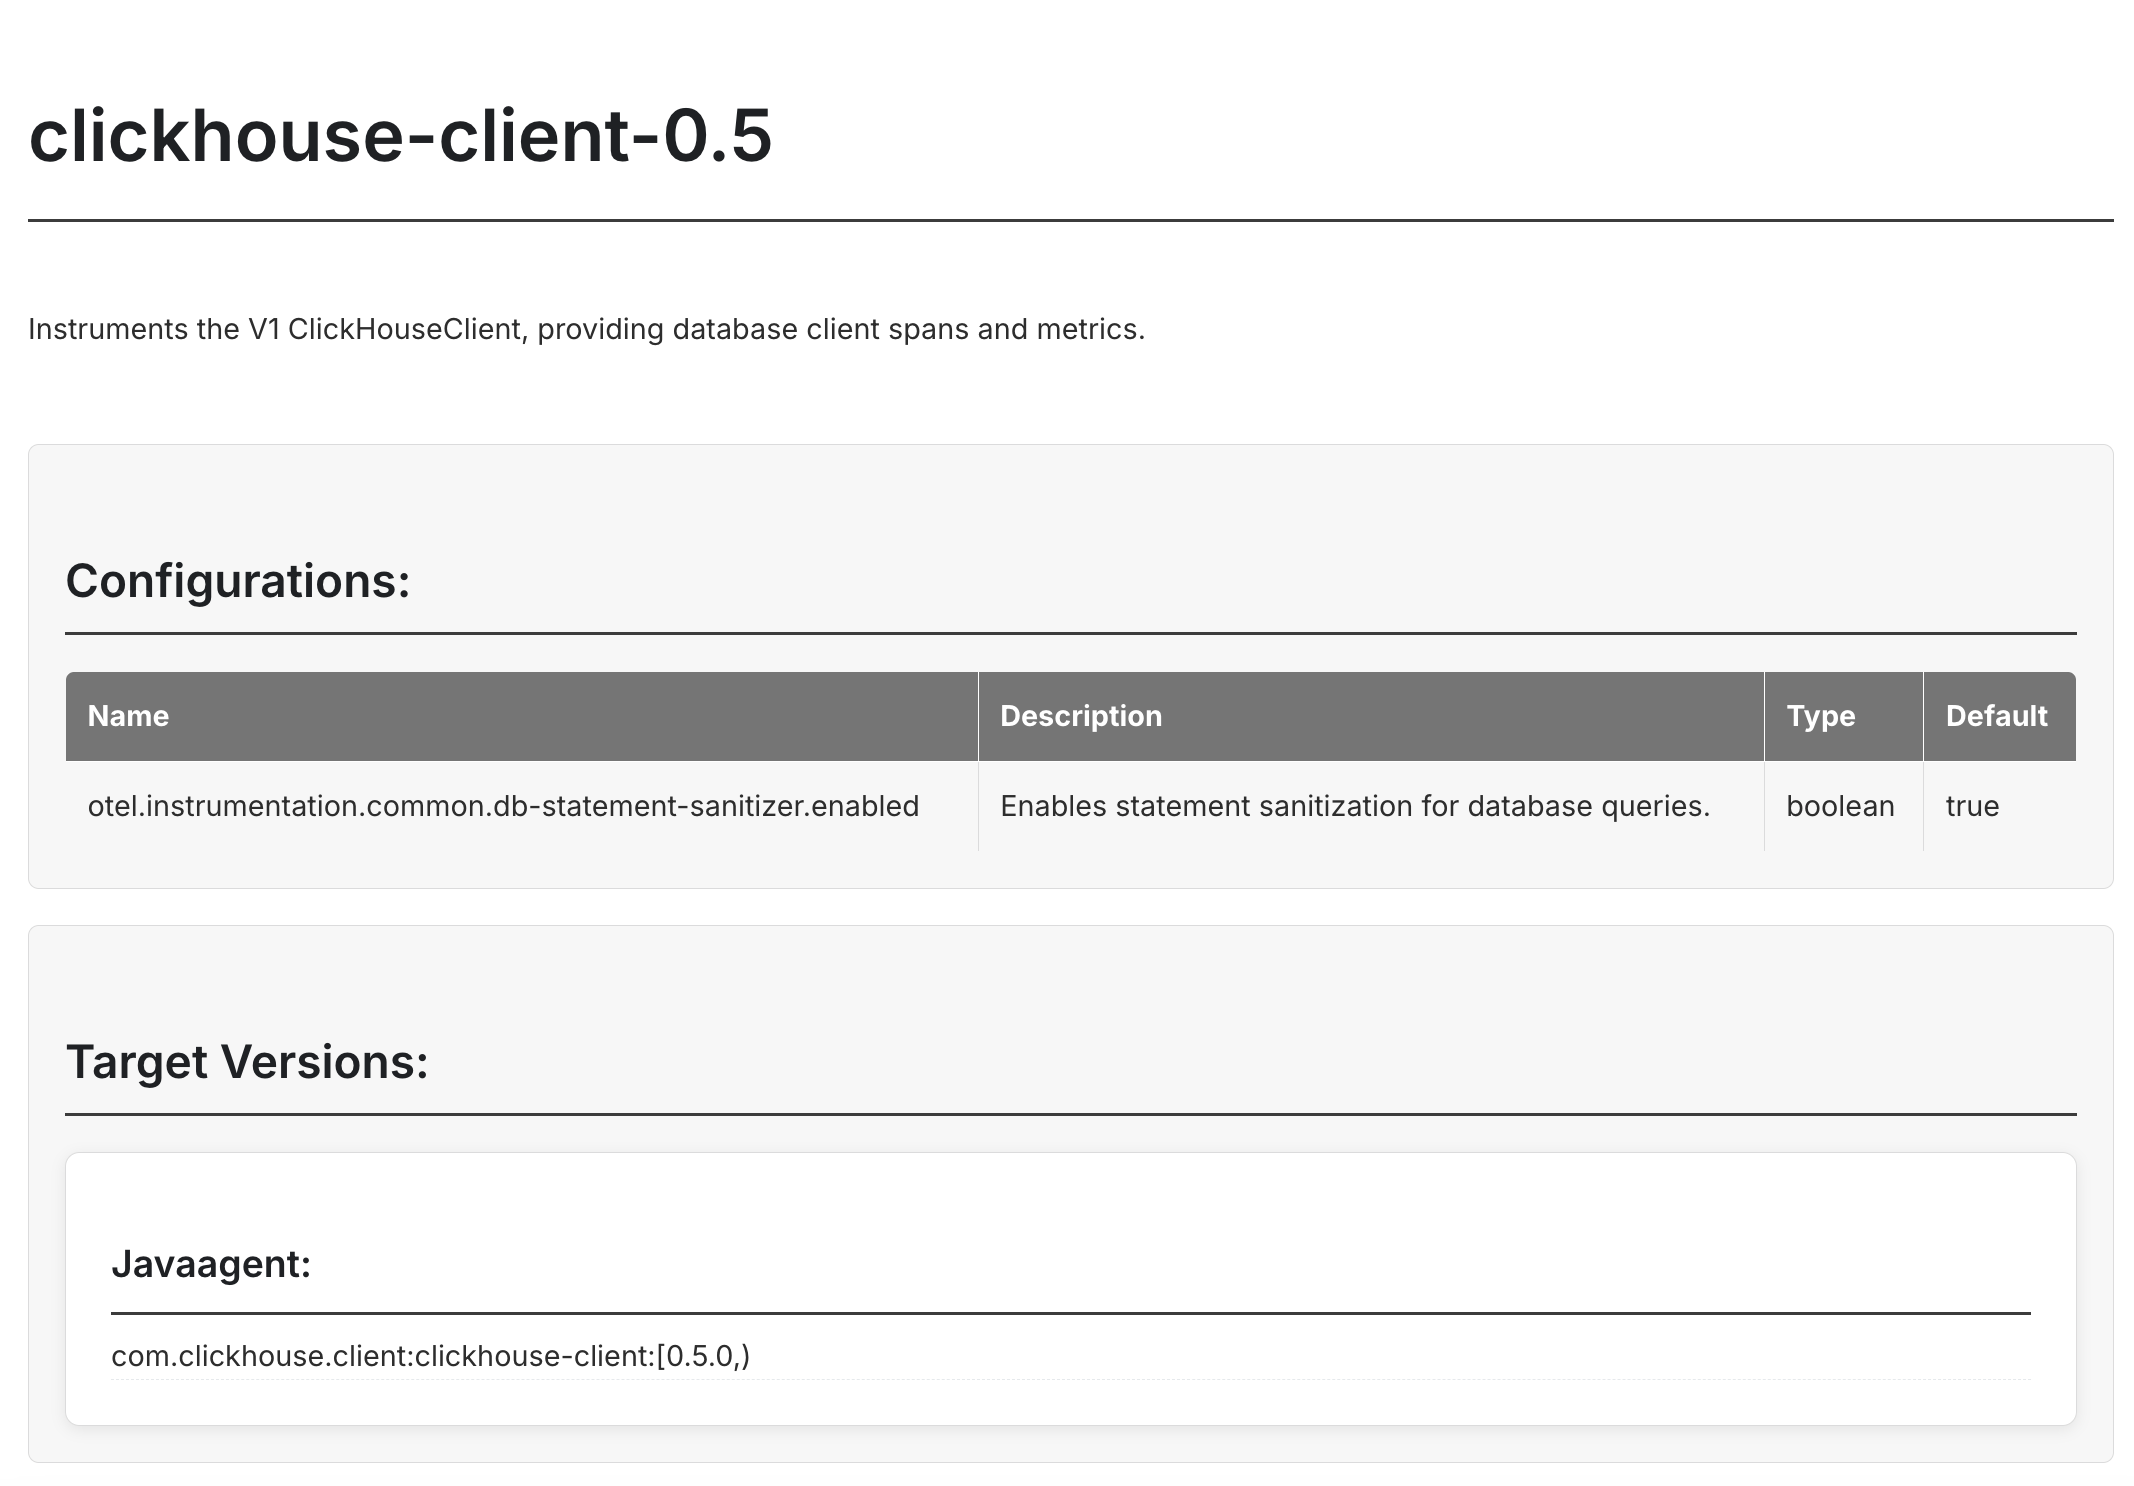
Instrumentation Details
When inspecting an individual instrumentation, we can see a description, the available configuration options, and the target versions of the library that are supported:
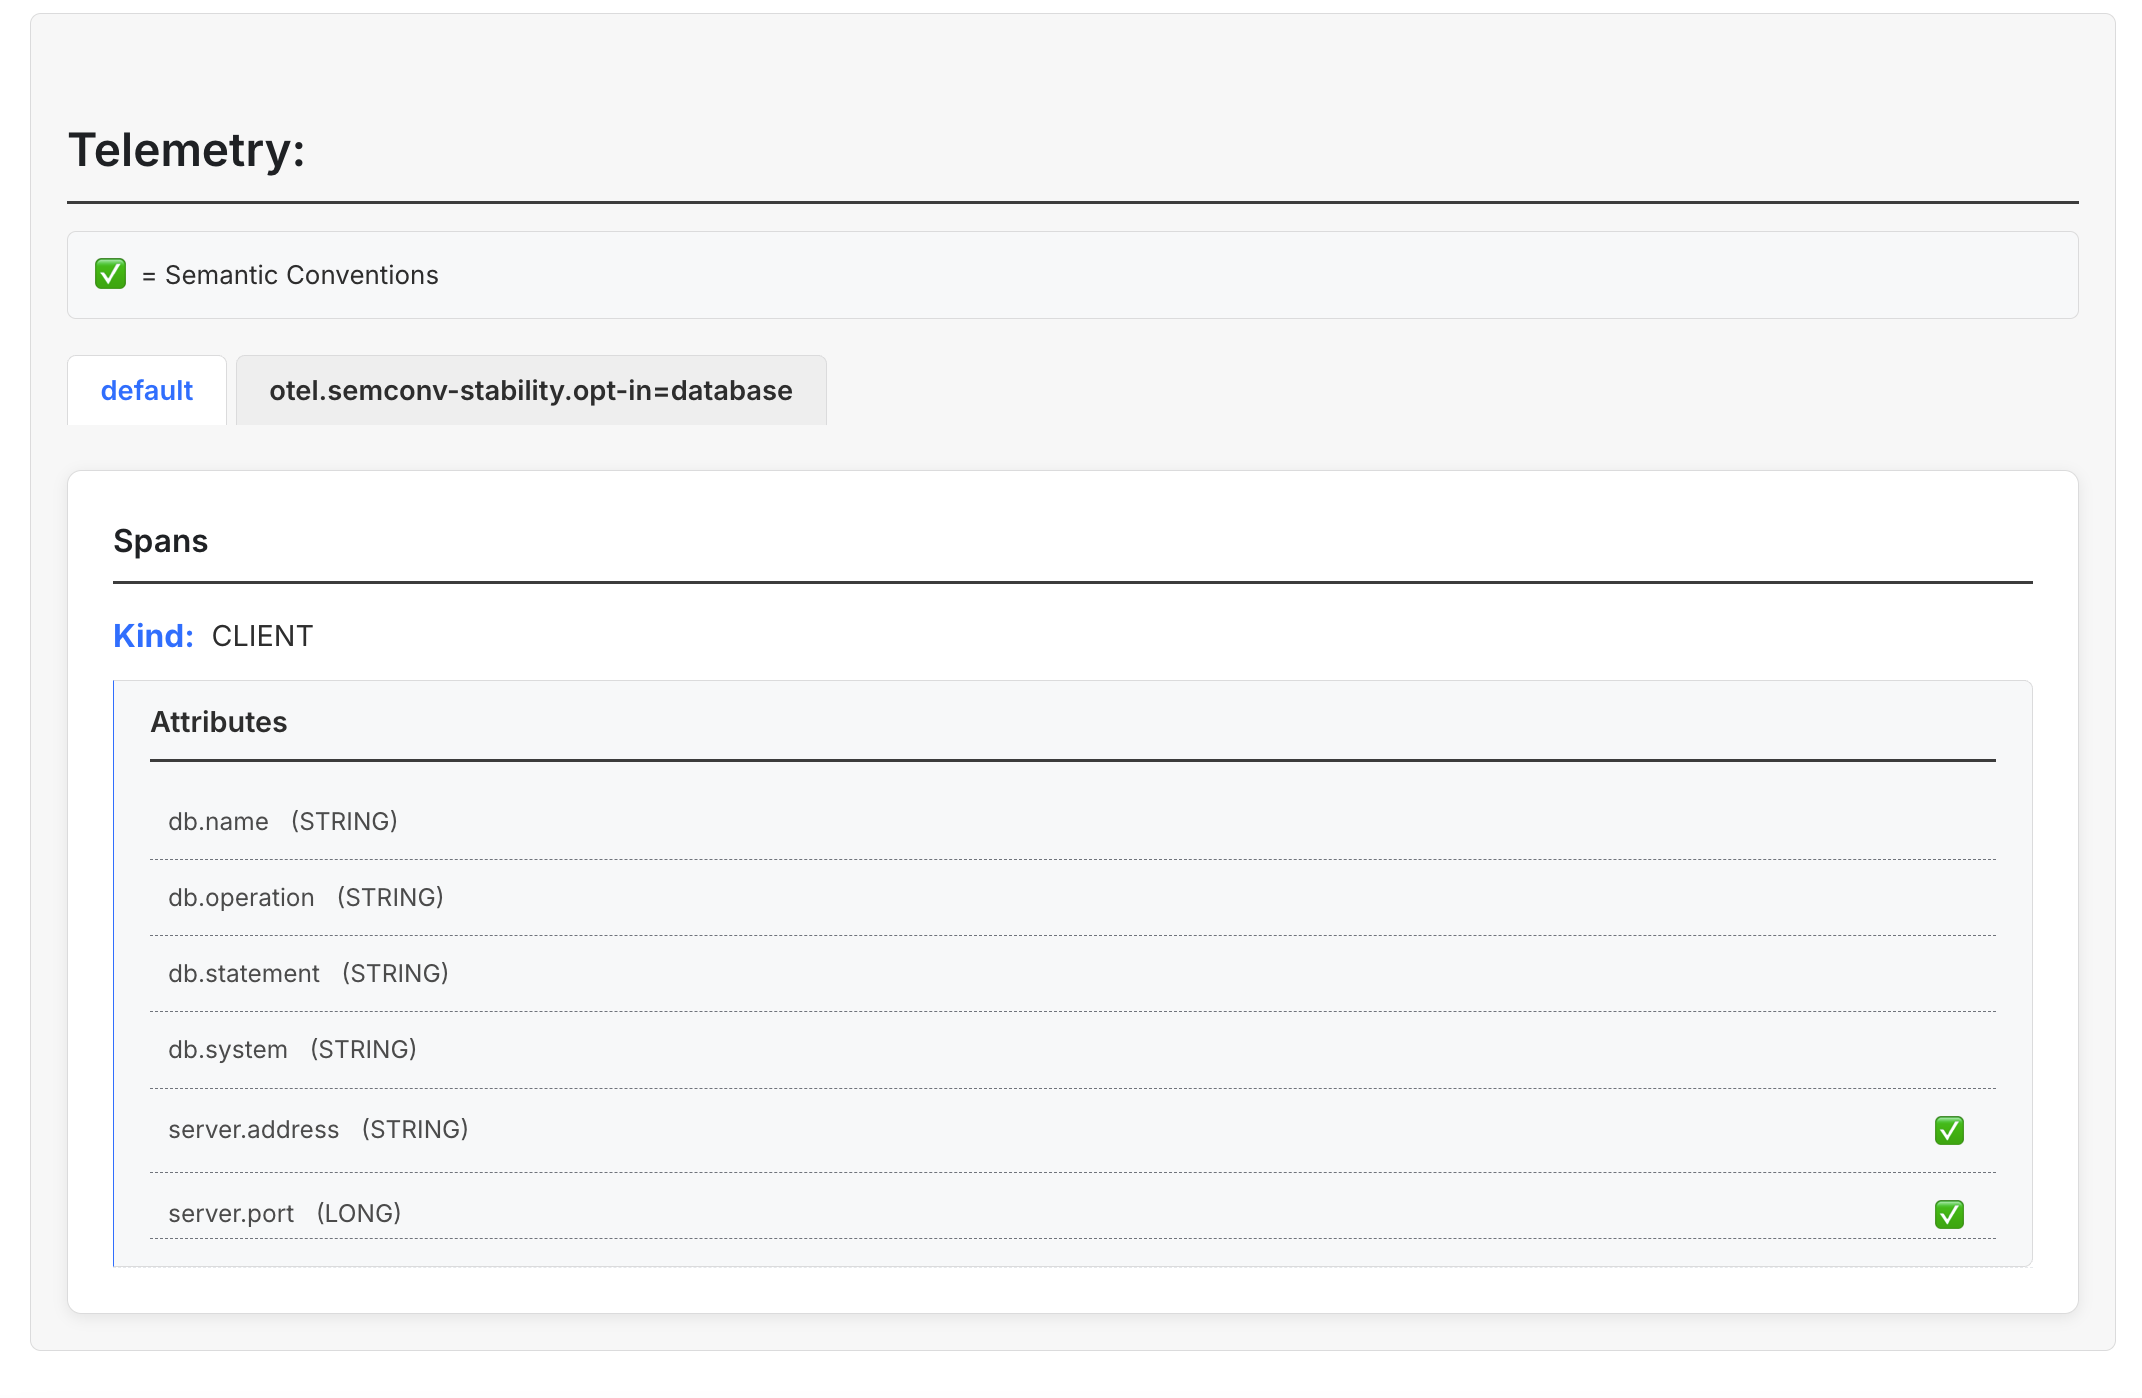
We can also see any telemetry emitted by default, and we can indicate which telemetry signals and attributes adhere to semantic conventions:
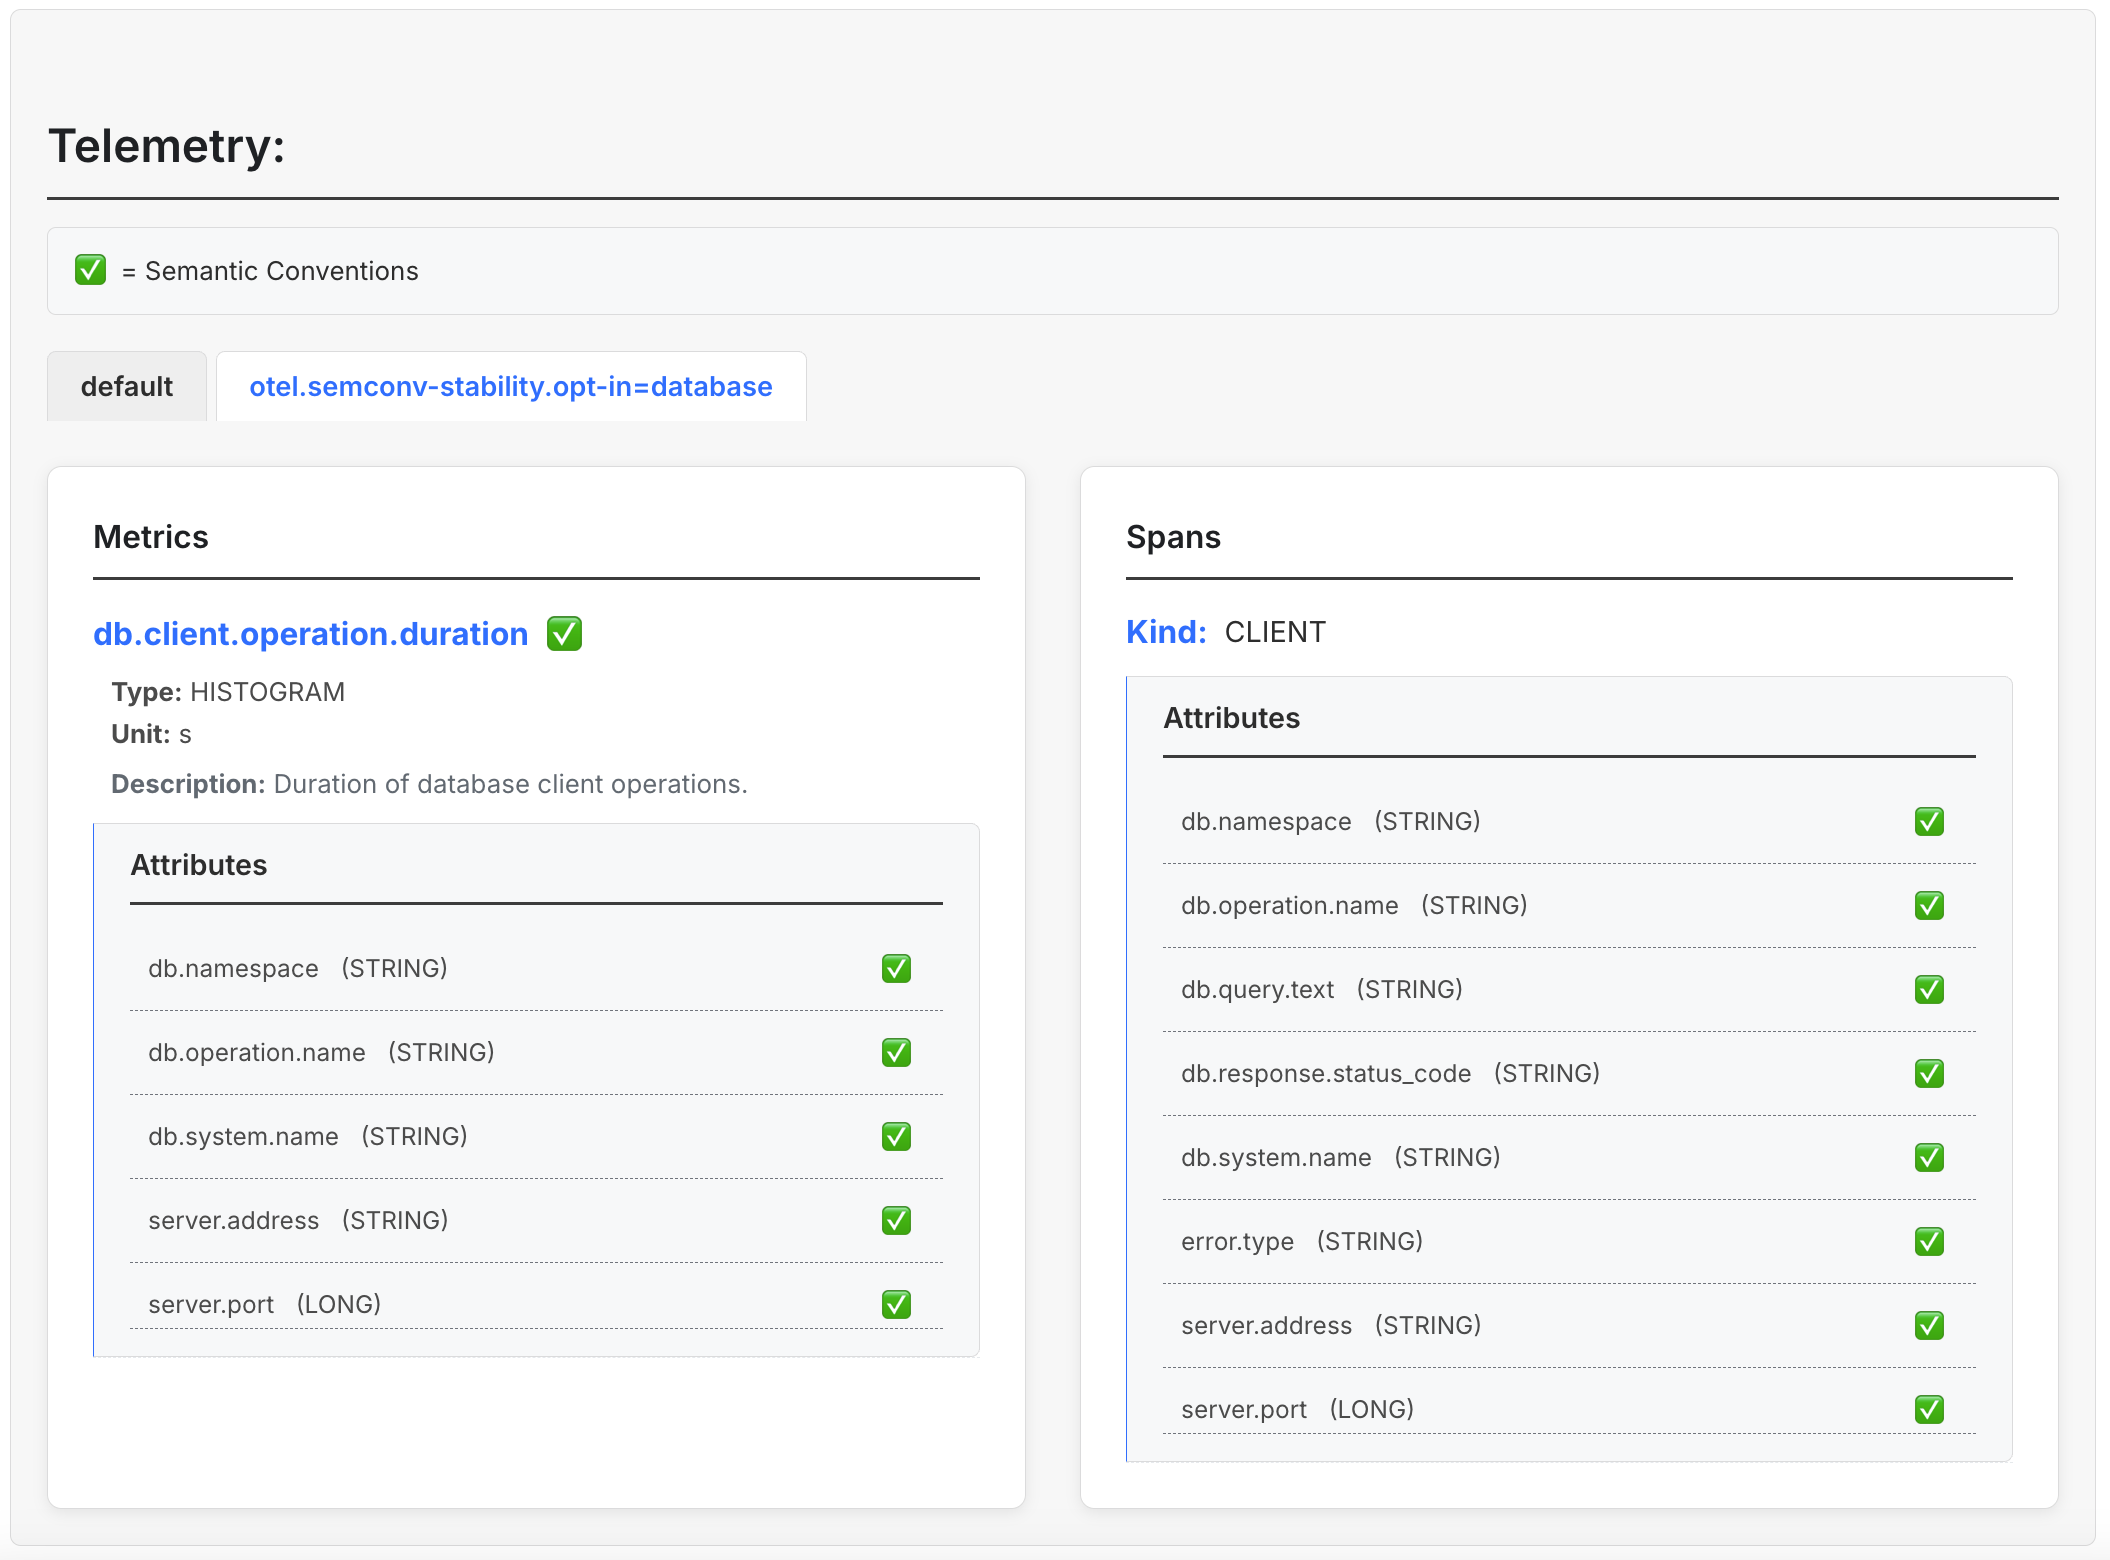
If we click on the otel.semconv-stability.opt-in=database in the telemetry section, we can see what changes in
terms of emitted telemetry. In this example, we can see that the resulting attributes are 100% compliant with semantic
conventions when that configuration option is set:
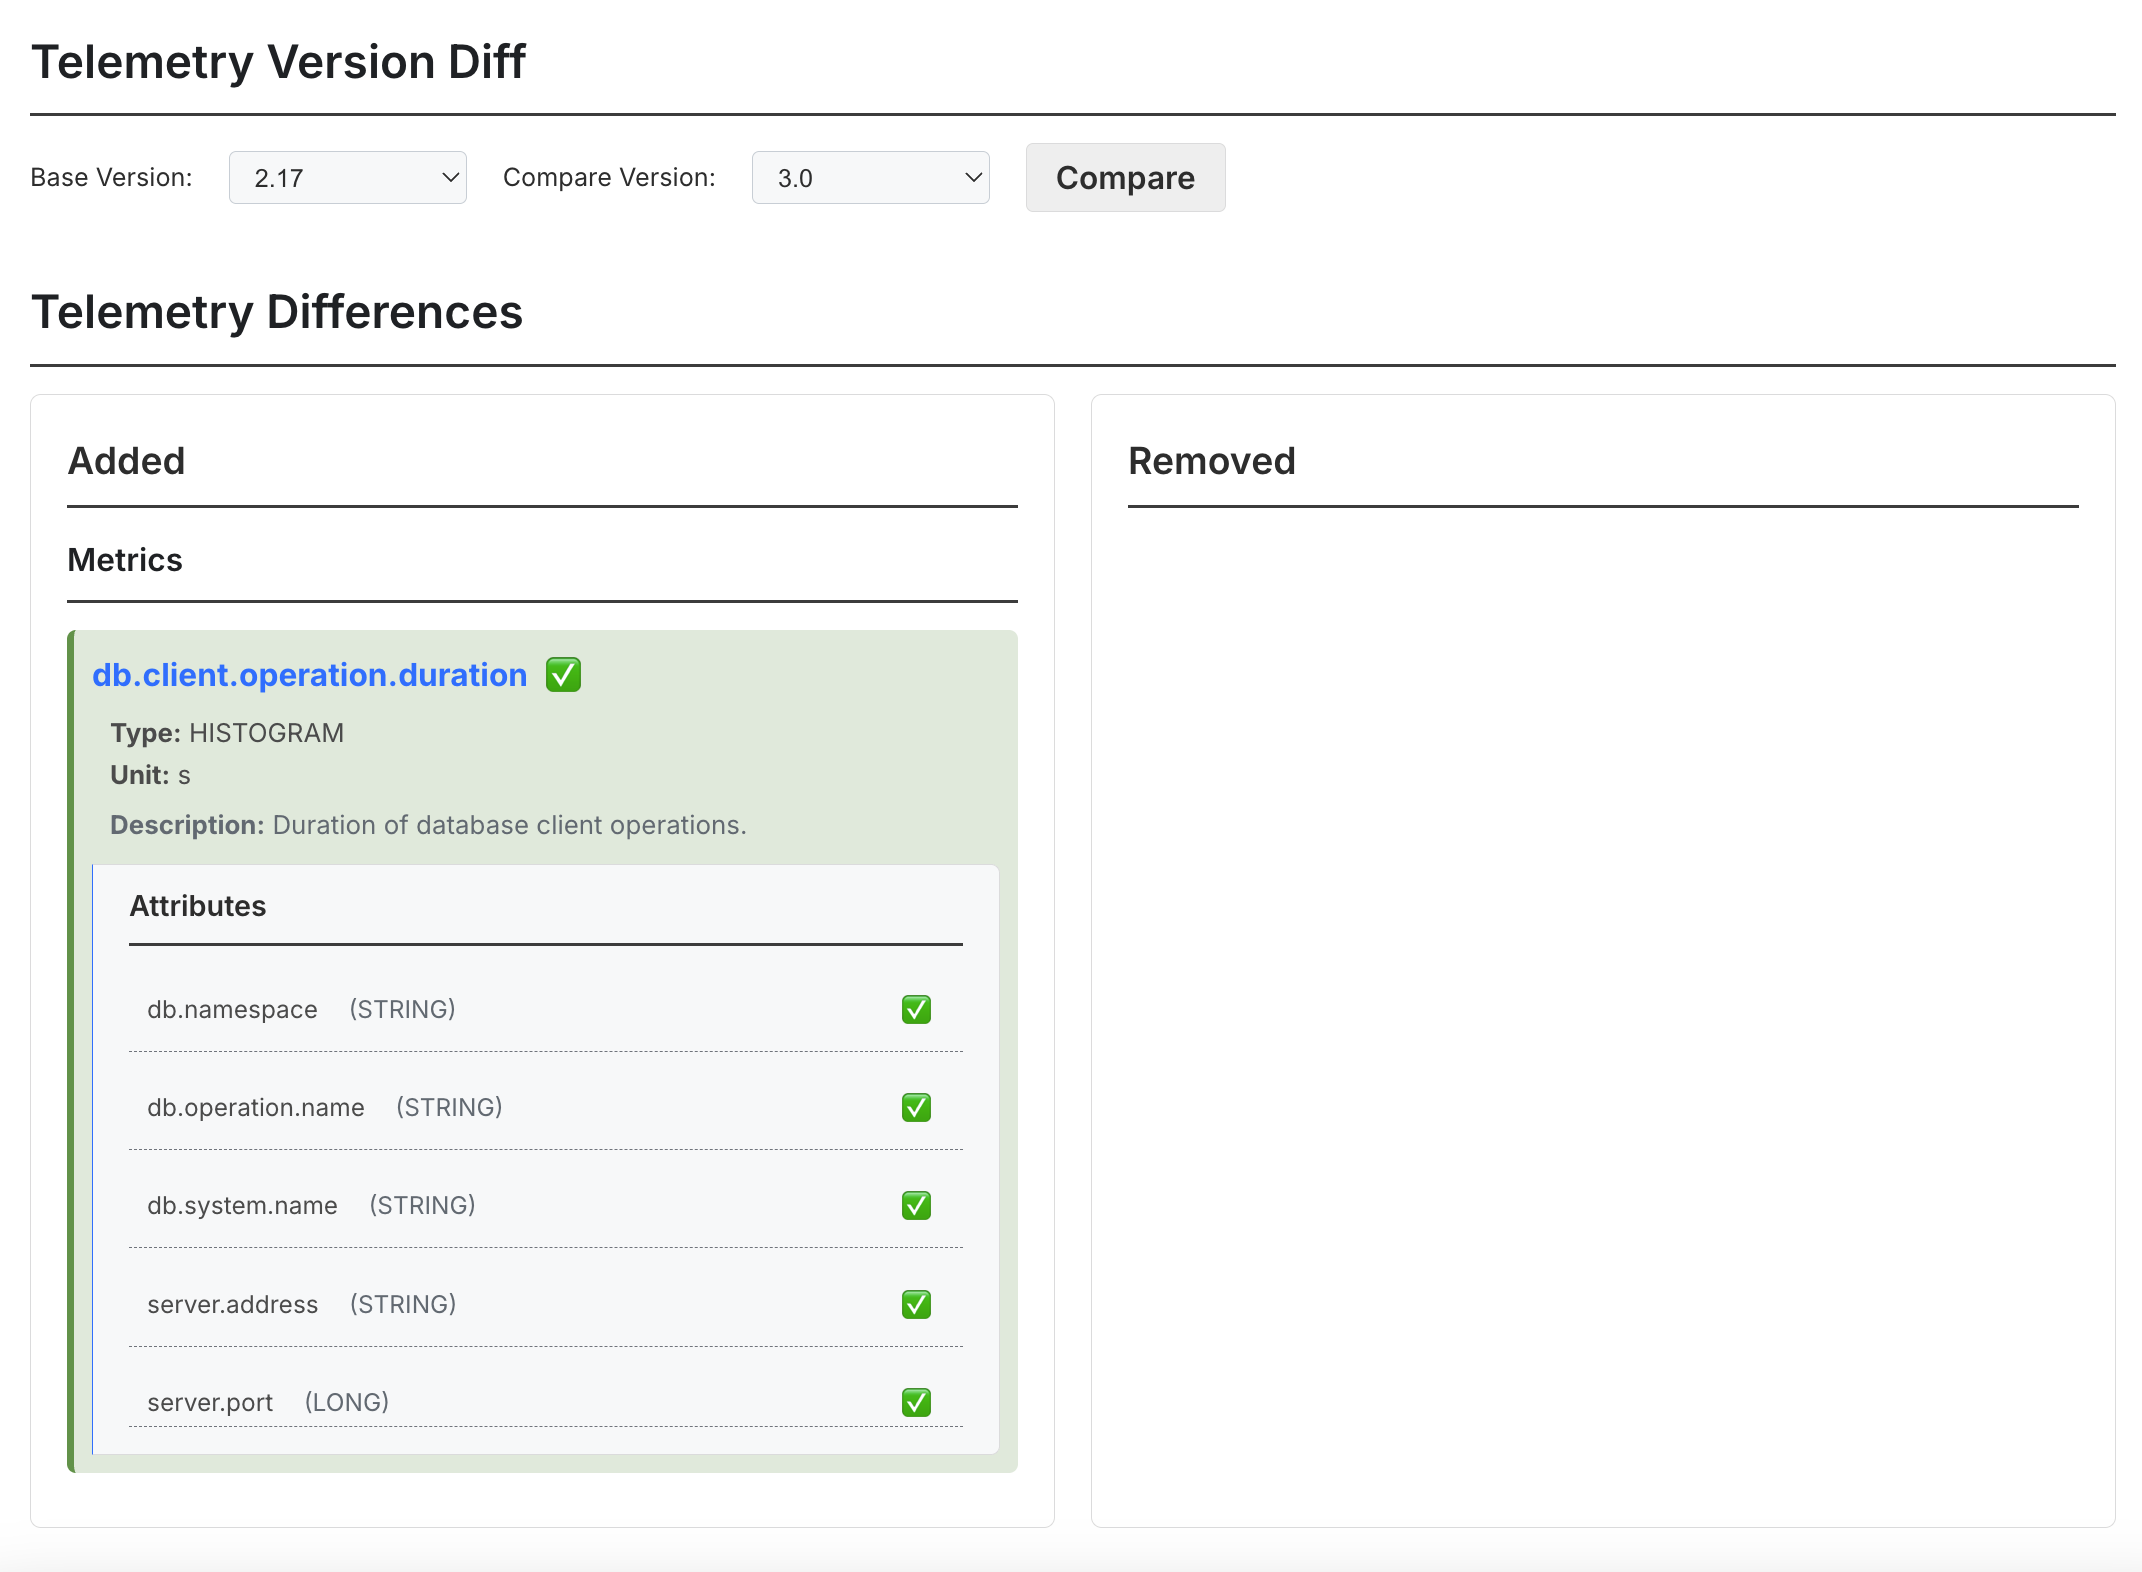
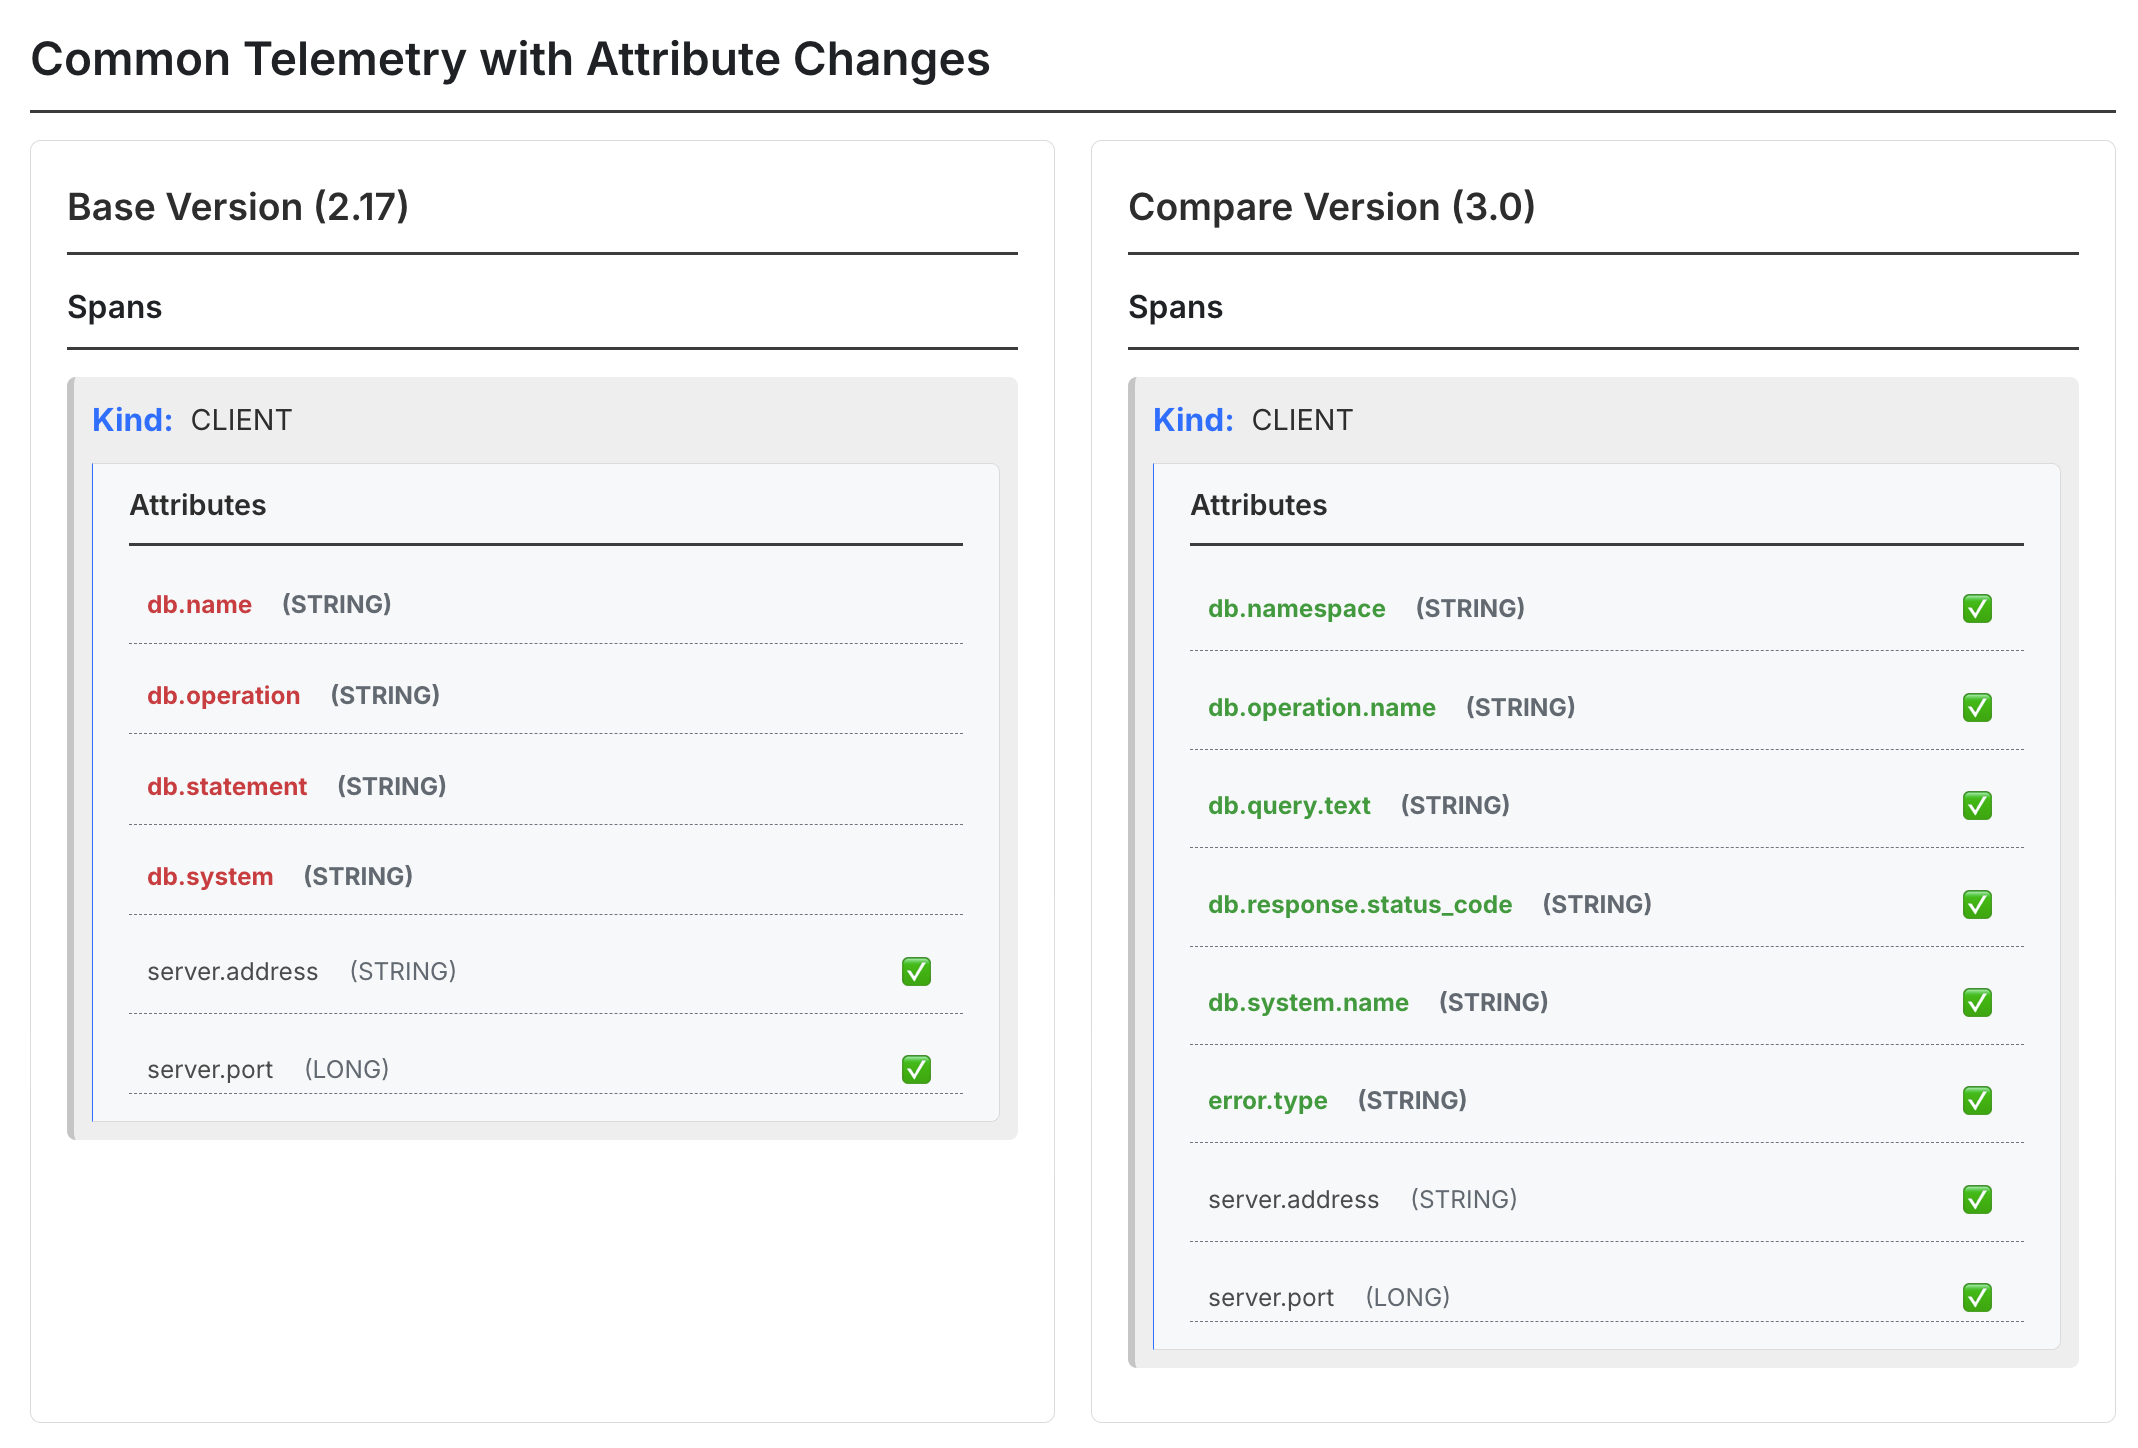
Java agent version diffing
One of the key capabilities will be the ability to compare emitted telemetry across different versions of the Java
agent. For example, in the upcoming 3.0 release (release date TBD), the agent will begin emitting stable semantic
conventions by default for components like databases (for example, the behavior previously controlled by the
otel.semconv-stability.opt-in=database setting). As a result, the default behavior for emitted metrics, spans, and
their associated attributes will change. By leveraging the metadata, we can understand what to expect from specific
instrumentations:
Next
There is still a lot of work to do in order to make this explorer useful. In another post I will go over more of the vision and capabilities of the “Analyze Service” page in the explorer, and discuss some other future features that I think would be cool to include. I also plan on covering my exploration of the OpenTelemetry Weaver project for things like documentation generation.
I also have a few PRs up for additional automation using the metadata:
- Nightly documentation site audit automation
- Cross-references the latest instrumentation-list.yaml contents with the contents on the opentelemetry.io site to identify when updates are needed.
- Nightly metadata synchronizer automation
- Runs the telemetry collection and analyzer and submits PRs for when there are updates or drift in the instrumentation-list.yaml file